Testing & evaluation
Atherion Zenith AI EA [MQLume] 1.6: +214.42% | XAUUSD · 12-month backtest
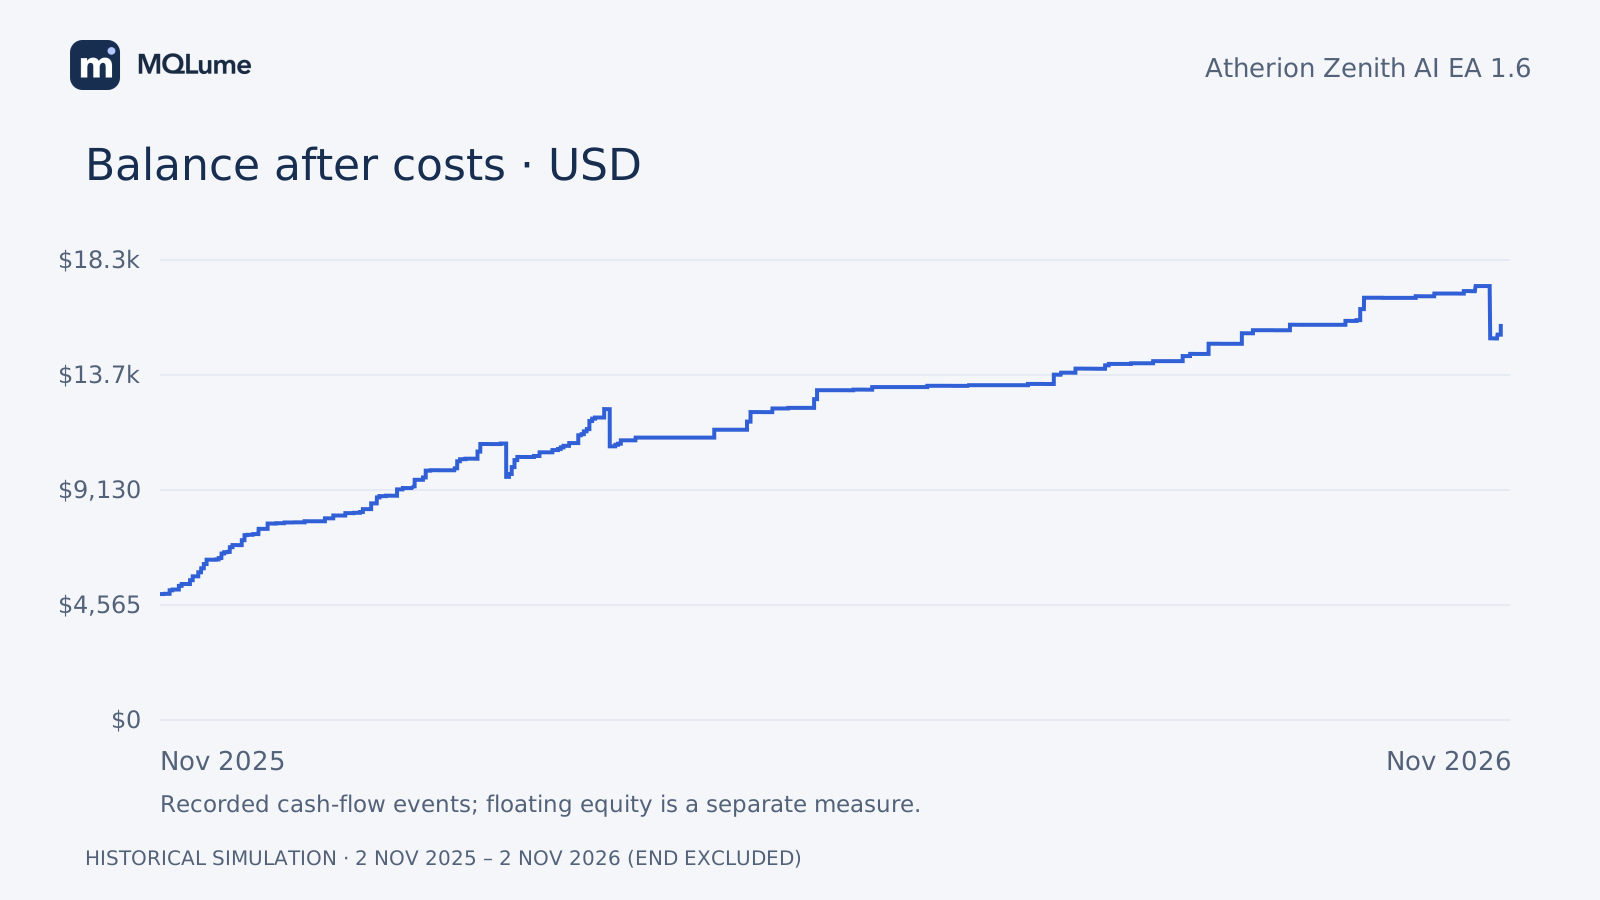
Atherion Zenith AI EA [MQLume] 1.6 recorded a cumulative net return of 214.42% in this XAUUSD historical test, with 21.52% maximum relative equity drawdown. Starting capital was USD 5,000 and the recorded ending balance was USD 15,720.81.
The report records a 214.42% cumulative return. Part of the test consults same-day closing prices before those closes would have been available, and also uses date-specific entries. The aggregate gain therefore cannot demonstrate forward-predictive performance. The selected ae_risk input was 2. Executed sizes ranged from 0.20 to 0.69 lots. Changing sizing does not resolve the historical information issue. The same-day future-price reference affects part of this test interval. Calling it a historical simulation does not remove that bias. The chart documents the run; it is not evidence of an executable forward strategy.
Test conditions
The interval is 2025-11-02 to 2026-11-02, with the end date excluded. The model is Every tick. Zero execution delay does not remove trading costs: commission and swap are included in net results; spread is reflected in execution prices.
| Setting | Value |
|---|---|
| Product | Atherion Zenith AI EA [MQLume] 1.6 |
| Interval | 2025-11-02 → 2026-11-02 |
| Chart | XAUUSD-ECN · H1 |
| Market data | VTMarkets-Live 7 |
| Starting balance | USD 5,000 |
| Leverage | 1:1000 |
| Model | Every tick |
| Execution delay | 0 ms |
Results and costs
| Setting | Value |
|---|---|
| Cumulative net return | 214.42% |
| Net profit | USD 10,720.81 |
| Ending balance | USD 15,720.81 |
| Maximum relative equity drawdown | 21.52% |
| Completed positions | 130 |
| Profit factor | 3.12 |
| Winning positions | 114 (87.69%) |
| Losing positions | 16 (12.31%) |
| Commission cash flow | USD -331.50 |
| Swap cash flow | USD 0.00 |
The balance chart follows cash flows from executed trades after costs. It is not a continuous equity curve. Relative equity drawdown separately includes floating profit and loss, and is different from the percentage attached to the largest monetary drawdown.
Monthly results
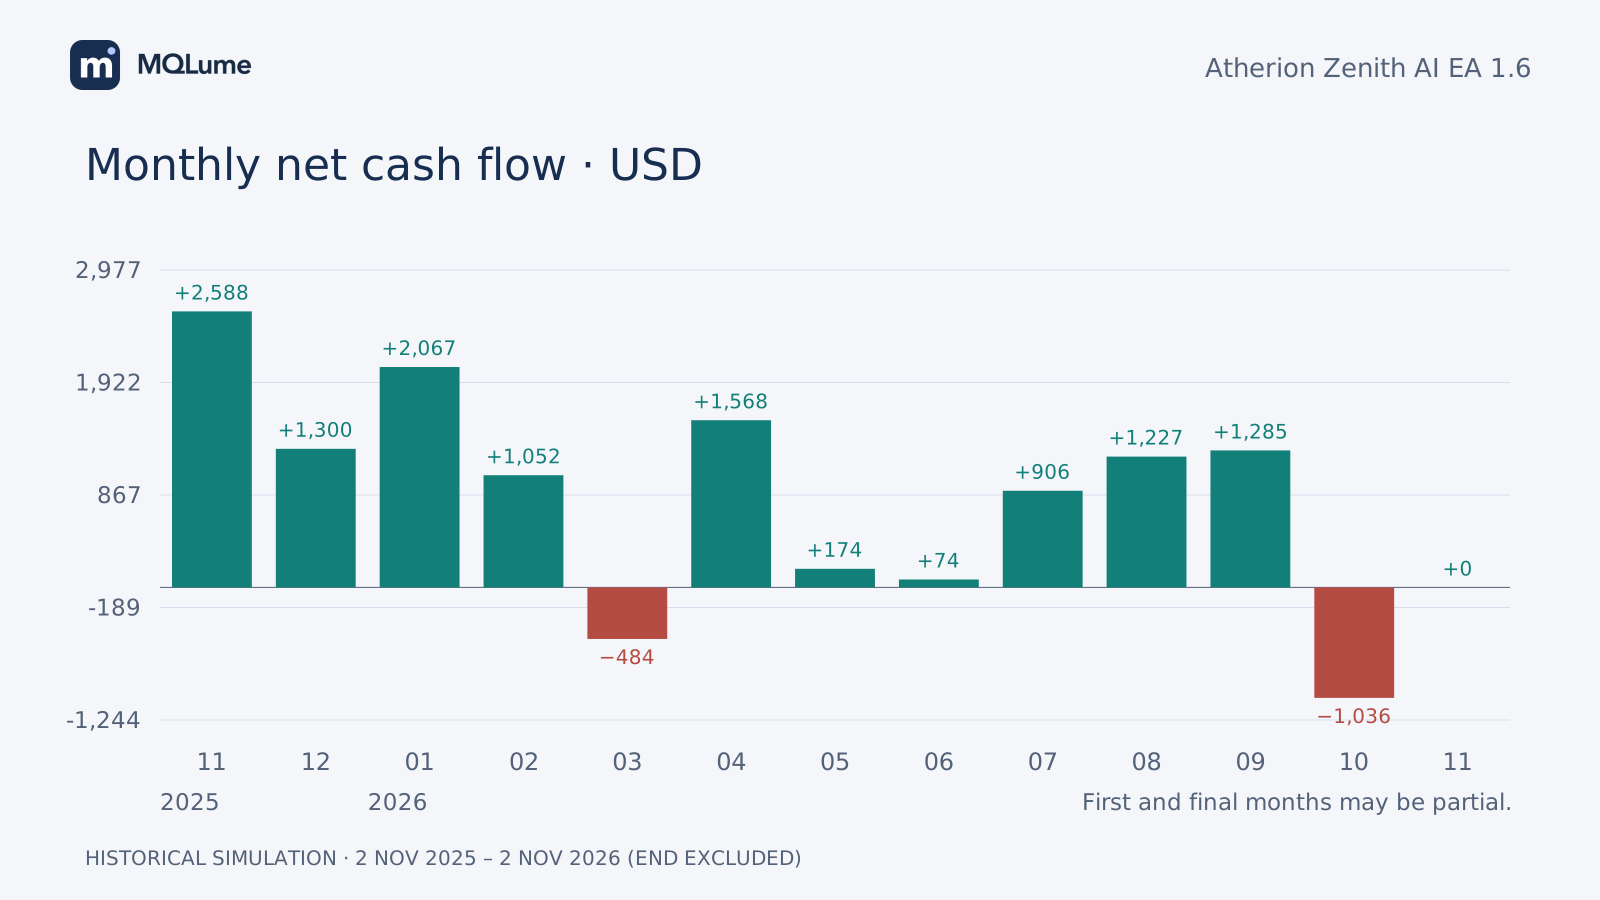
All calendar months are shown, including negative and zero months. The first and last months are partial. Positive monthly closed cash flow does not mean there were no floating losses during that month.
| Month | Net cash flow, USD |
|---|---|
| 2025-11 | 2,588.49 |
| 2025-12 | 1,299.55 |
| 2026-01 | 2,066.79 |
| 2026-02 | 1,052.06 |
| 2026-03 | -483.51 |
| 2026-04 | 1,567.86 |
| 2026-05 | 174.09 |
| 2026-06 | 74.20 |
| 2026-07 | 906.35 |
| 2026-08 | 1,226.76 |
| 2026-09 | 1,284.58 |
| 2026-10 | -1,036.41 |
| 2026-11 | 0.00 |
Automatic sizing
These are the selected sizing inputs. Selection used a limited set of candidates on this same interval, not an independent unseen period or an exhaustive optimisation. A risk-level or balance-step input is not an account loss limit. Individual fills and combined open exposure are different quantities; increasing an input need not scale profit and drawdown proportionally.
| Setting | Value |
|---|---|
| ae_risk | 2 |
| Executed lot range | 0.2–0.69 |
| Peak combined open lots | 0.69 |
Reading this test
These figures describe the recorded configuration and interval. Broker conditions, costs and another period can change the result. Historical drawdown is not a future loss ceiling. This review is produced by MQLume, the seller, and is not a verified live-account record or a forecast. Trading involves risk, including loss of capital.
Explore the product
The product page lists the available files and settings. Keep an unchanged baseline and compare one intended change at a time. Which setting or test period would you explore next?