Testing & evaluation
Gold369 PR [MQLume] 5.31:+253,008.77% | 12-month XAUUSD backtest
Gold369 PR [MQLume] 5.31 recorded a cumulative net return of +253,008.77% in this XAUUSD historical test, with 29.80% maximum relative equity drawdown. Starting capital was USD 5,000; the ending balance was USD 12,655,438.58.
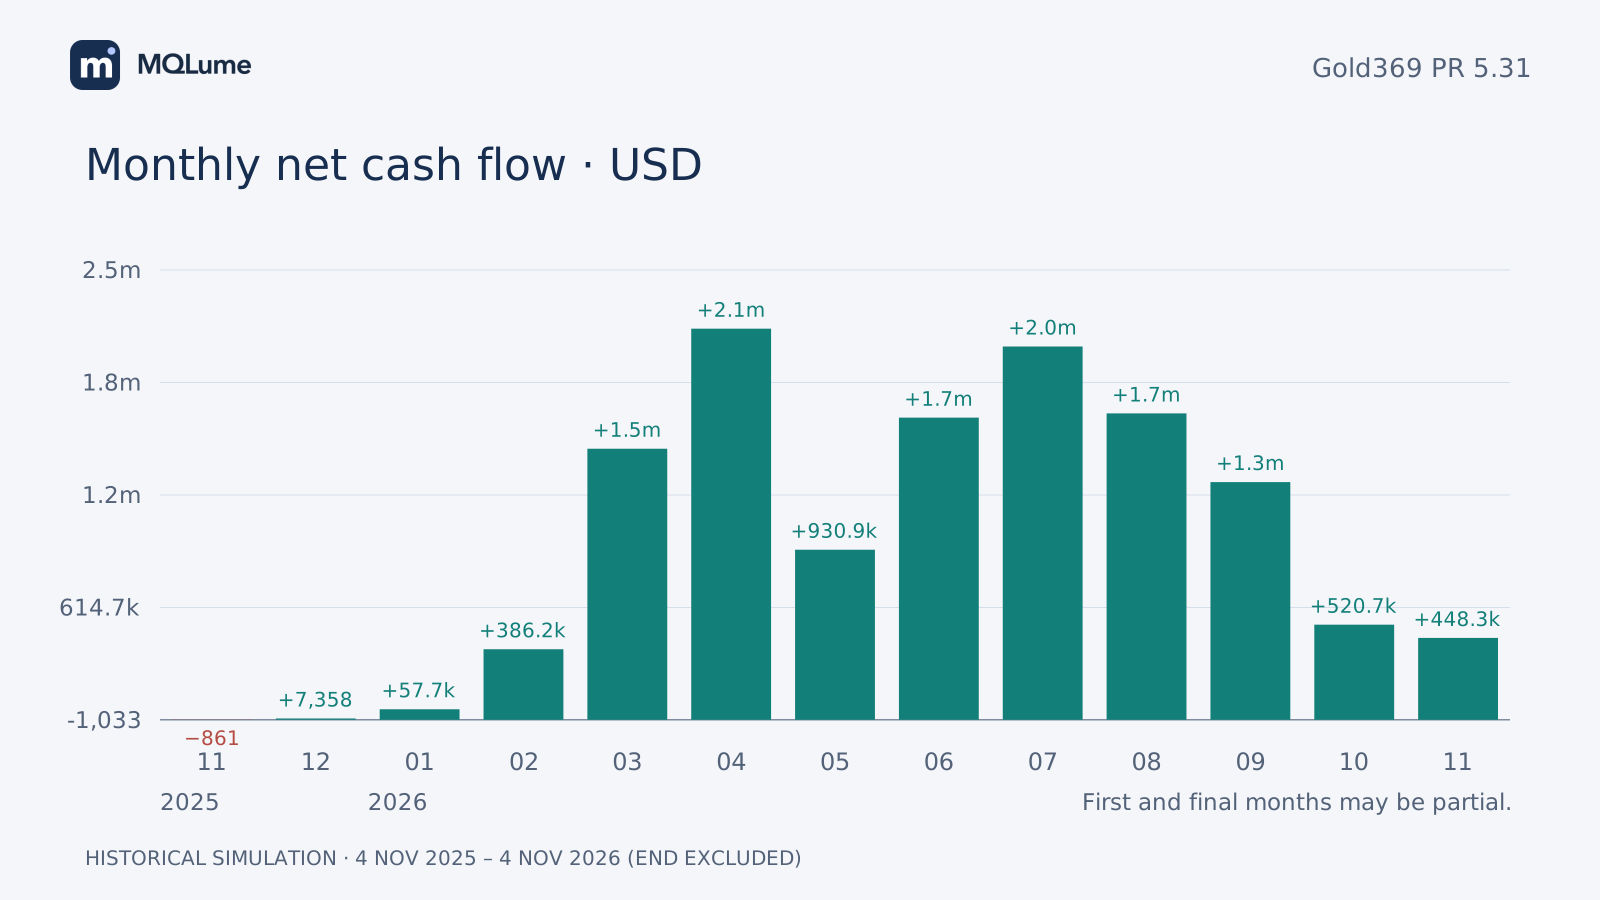
Gold369 began with a loss of USD 860.79 in the partial first month. April later added USD 2,140,900 as positions grew. The final total reflects changing exposure, not a constant small lot.
Test conditions
The test runs from 2025-11-04 00:00 to 2026-11-04 00:00 in historical server time; the end instant is excluded. The model is Every tick. Execution delay is 0 ms, but costs remain: commission and swap are included in net results, and spread is reflected in fill prices.
| Setting | Value |
|---|---|
| Product | Gold369 PR [MQLume] 5.31 |
| Interval | 2025-11-04 00:00 → 2026-11-04 00:00 |
| Chart | XAUUSD-ECN · M30 |
| Market data | VTMarkets-Live 7 |
| Starting balance | USD 5,000 |
| Leverage | 1:1000 |
| Model | Every tick |
| Execution delay | 0 ms |
Results and costs
| Setting | Value |
|---|---|
| Cumulative net return | +253,008.77% |
| Net profit | USD 12,650,438.58 |
| Ending balance | USD 12,655,438.58 |
| Maximum relative equity drawdown | 29.80% |
| Completed positions | 651 |
| Profit factor | 5.07 |
| Winning positions | 500 (76.80%) |
| Losing positions | 151 (23.20%) |
| Commission cash flow | USD -286,318.86 |
| Swap cash flow | USD 0.00 |
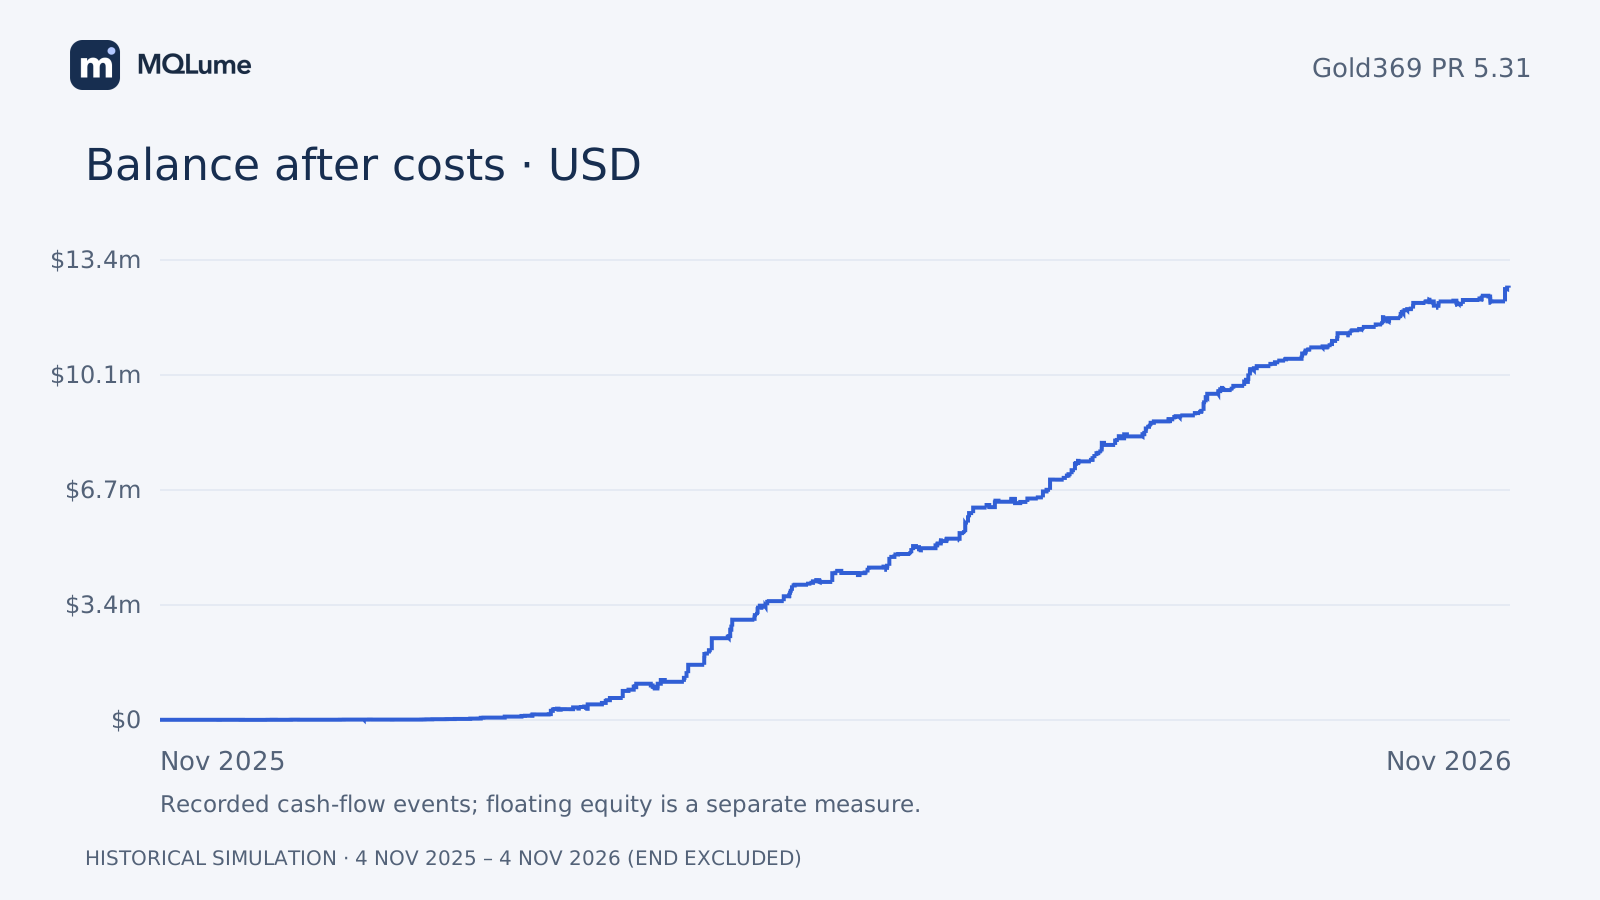
Return = net profit ÷ USD 5,000 × 100. It is cumulative, not annualised. The chart follows the balance after executed deals and costs, not continuous equity. Maximum relative equity drawdown includes floating profit and loss; the percentage beside the largest monetary drawdown can refer to a different moment.
Monthly results
All 13 calendar buckets are included. The first and last November buckets are partial. Chart labels are in English; the complete monthly values appear below.
| Month | Net cash flow, USD |
|---|---|
| 2025-11 | -860.79 |
| 2025-12 | 7,357.61 |
| 2026-01 | 57,708.28 |
| 2026-02 | 386,226.83 |
| 2026-03 | 1,483,706.65 |
| 2026-04 | 2,140,900.00 |
| 2026-05 | 930,900.00 |
| 2026-06 | 1,654,000.00 |
| 2026-07 | 2,043,200.00 |
| 2026-08 | 1,677,200.00 |
| 2026-09 | 1,301,100.00 |
| 2026-10 | 520,700.00 |
| 2026-11 | 448,300.00 |
Selected parameters and exposure
These are research settings selected on this same historical interval, not product defaults or an unseen validation sample. Calibration stopped when relative equity drawdown entered the 27–30% target band; it was not an exhaustive search for maximum profit. Individual fills and total simultaneous exposure are different quantities. No positions remained open at the end.
| Setting | Value |
|---|---|
| inp_UseMultiProfileMode | true |
| inp_PortfolioScalperRiskPercent | 1.85 |
| inp_PortfolioUltimateRiskPercent | 7.4 |
| Executed lot range | 0.25–100 |
| Peak combined open lots | 200.00 |
Reading this test
Gold369 used a performance-tuned research build. A separate annual comparison matched the delivery build at lower risk settings; the final 1.85% / 7.4% configuration was not rerun on the delivery build.
MQLume, the seller, produced this review. These are historical simulations, not verified live-account results. Costs, execution, position limits and another period can change the outcome; historical drawdown is not a future loss ceiling. Trading can result in loss of capital.
Explore the product
Inspect the editable source, EA and parameter guide on the product page. Keep an unchanged baseline and compare one intended change at a time. Which parameter or test period would you explore next?