Indicators
MT5 Parabolic SAR: chart dots are not broker stop orders
What the dots represent
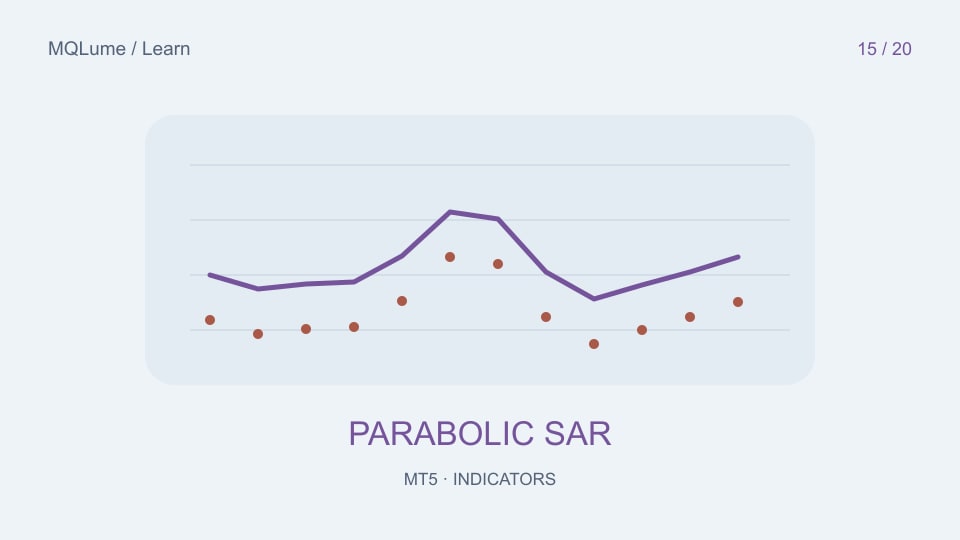
Parabolic SAR plots a level that evolves with the selected directional state and acceleration settings. Its dots can move from below price to above price when the state reverses. The displayed level is an indicator output; attaching it to a chart does not place or modify a broker-side stop order.
This distinction matters when a tutorial describes SAR as a trailing stop. It can supply an input to a trailing-stop rule, but an EA or manual action must still implement that rule.
Step and maximum affect responsiveness
The step controls how the acceleration factor changes, while the maximum limits it. Increasing responsiveness can bring the plotted level closer to price and increase reversal frequency. It does not create a free improvement in exits.
Compare one setting at a time on the same interval. Include choppy periods where repeated flips are visible, rather than only a long smooth trend.
A plotted level needs execution rules
To use SAR in an experimental stop rule, specify whether you read the current or last closed bar, how the level is rounded to tick size, and whether a stop is allowed to move farther from the market. Check the broker's stop and freeze constraints before submitting a modification.
A synthetic level of 100.03 on a symbol with tick size 0.05 is not a valid price increment. The rounding direction and minimum distance must be chosen for the order side and rule. A failed modification must not be reported as a protected position.
Distinguish signal changes from filled exits
Current-bar SAR behaviour and a historical final dot are different observations. If price crosses a proposed stop between sampled points, the result depends on the price path and execution model. A visual line alone cannot establish the actual fill price.
Record the requested stop, accepted stop and any error separately in a simulation. A gap can also produce an execution price different from the plotted level, so the indicator should not be presented as a guaranteed loss cap.
Check a trend and a whipsaw sequence
Mark reversal timestamps on a clean chart, then compare a directional interval with a ranging interval. Count flips and observe their delay. If you implement an EA consumer, test duplicate modifications and invalid-price handling before evaluating profit.
The invalid-stops guide and price-unit guide explain the execution details that an indicator drawing does not handle for you.