Testing & evaluation
EA Super Trend XAUUSD MT5 2.1: +339,106.85% in the latest 12-month XAUUSD backtest
Build on a complete gold strategy. Explore a +339,106.85% historical net return, 28.56% maximum equity drawdown and the automatic-sizing settings behind this XAUUSD test.
The latest 12-month result
From 2025-10-20 to 2026-10-20, excluding the end date in broker time, EA Super Trend XAUUSD MT5 2.1 recorded +339,106.85% net return. US$1,000 became US$3,392,068.50, after recorded costs. Maximum percentage equity drawdown was 28.56%.
This review is produced by MQLume, the seller. It uses the selected automatic-sizing configuration tested on IC Markets data. It is a historical simulation, with sizing calibrated on this same period.
What makes this EA different?
Super Trend combines two embedded models with balance-based sizing, configurable position spacing, partial closes and trailing stops. The visual SuperTrend overlay helps you inspect the chart while the source gives you control over the implementation.
Complete editable source makes the implementation available for your own study and customisation. You can work beyond a settings panel: inspect a calculation, draft a new filter with an AI coding assistant, and compare the modified version with an untouched baseline.
The exact test setup
| Broker feed | IC Markets |
|---|---|
| Symbol / chart | XAUUSD / H1 |
| Initial capital / leverage | US$1,000 / 1:1000 |
| Model / delay | Real ticks / 150ms |
| Automatic sizing | 0.01 lot per US$800 balance |
| Report trades | 1386 |
| Profit factor | 2.23 |
Selected inputs: UseAutoLot=true; LotPerStep=0.01; BalancePerLot=800. Other strategy inputs keep their delivered defaults. Report trade counts include partial exits where used; they are not a count of independent entry signals.
Balance after costs
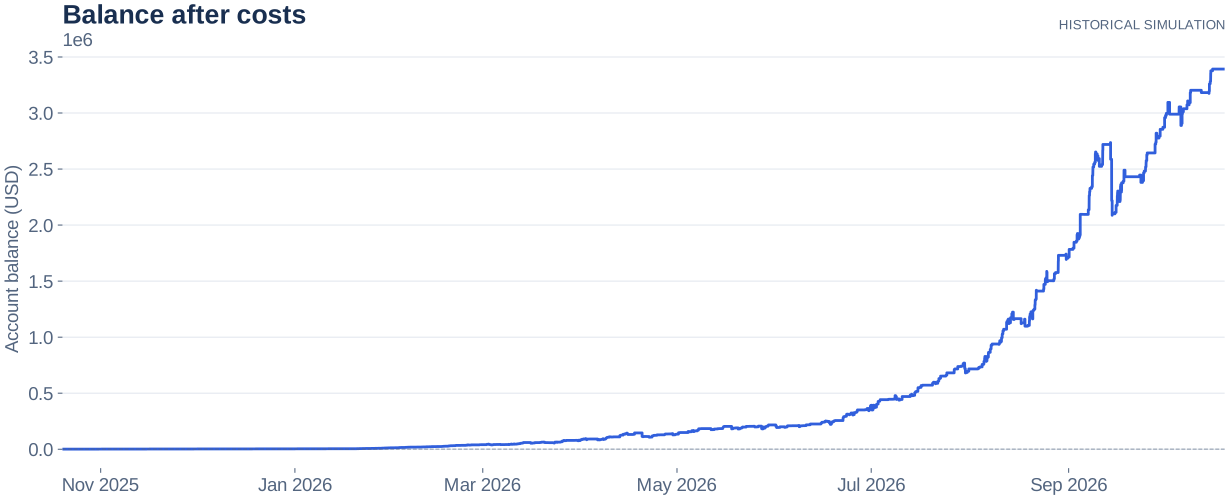
Automatic sizing compounds changes in balance. The resulting cash gains and losses do not stay constant through the year. Maximum equity drawdown comes from MT5's percentage-equity field; a balance chart cannot replace that metric.
All monthly results
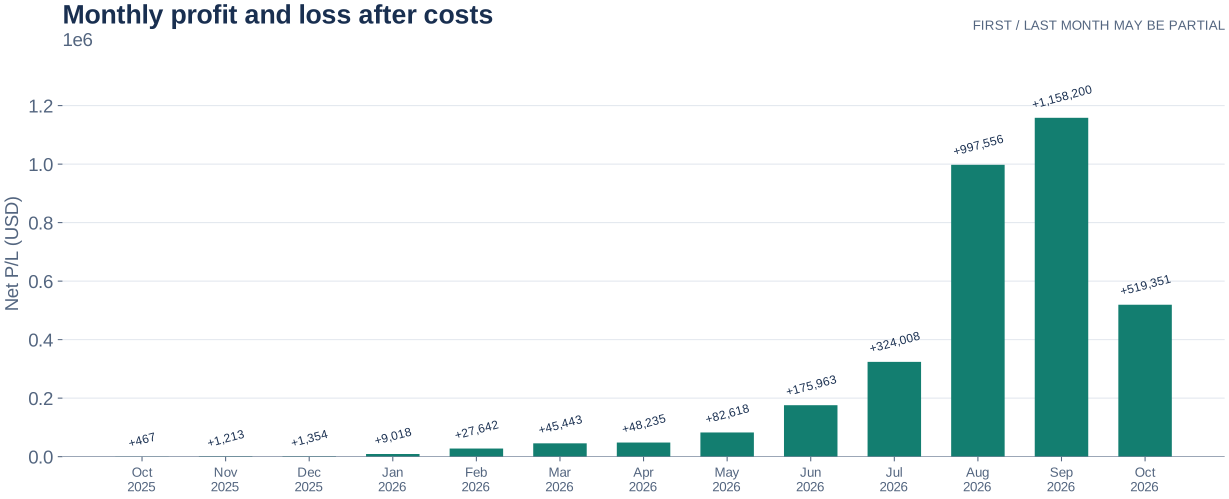
| Month | Net profit / loss |
|---|---|
| 2025-10 | US$+467.22 |
| 2025-11 | US$+1,213.10 |
| 2025-12 | US$+1,353.74 |
| 2026-01 | US$+9,018.37 |
| 2026-02 | US$+27,642.15 |
| 2026-03 | US$+45,442.75 |
| 2026-04 | US$+48,235.28 |
| 2026-05 | US$+82,617.56 |
| 2026-06 | US$+175,962.81 |
| 2026-07 | US$+324,007.50 |
| 2026-08 | US$+997,556.49 |
| 2026-09 | US$+1,158,200.07 |
| 2026-10 | US$+519,351.46 |
What the net figure includes
Net profit of US$3,391,068.50 reconciles to trading profit of US$3,436,898.09, commission of US$-30,713.16, and swap of US$-15,116.43. Bid-ask spread is already reflected in execution prices and is not deducted twice.
Make the source your own
The package contains the complete MQ5 source, compiled EX5, README.txt, PARAMETERS.pdf and RELEASE_NOTES.txt. No extra MQH or DLL downloads are required. Your personal-use licence has no additional activation or usage fees.
For your first change, keep a clean copy, make one small edit, compile in MetaEditor and compare the result in the Strategy Tester. An AI assistant can explain code and suggest edits; you remain in control of what you compile and run.
Explore EA Super Trend XAUUSD MT5 2.1 source code · Compilation guide
Reading the result responsibly
This is one broker feed and one historical interval, selected after automatic-sizing calibration. It is not a live track record or an independent forward test. Historical drawdown below 30% is not a future loss limit. Reproduce the settings and test on a demo account before considering live use. Past and simulated performance does not guarantee future returns.
Back to top