Indicators
MT5 Ichimoku: cloud shifts and the future-data trap
Identify the five components
Ichimoku combines conversion and base lines, two leading spans and a lagging span. The conversion and base lines use midpoints of high–low ranges over their selected periods. Span A combines those lines; Span B uses a longer range midpoint. The lagging span displays a close at an earlier chart position.
Record all three periods before comparing screenshots. Familiar defaults are a starting convention, not evidence that the same settings are best for every instrument or session.
Plotted ahead does not mean known future price
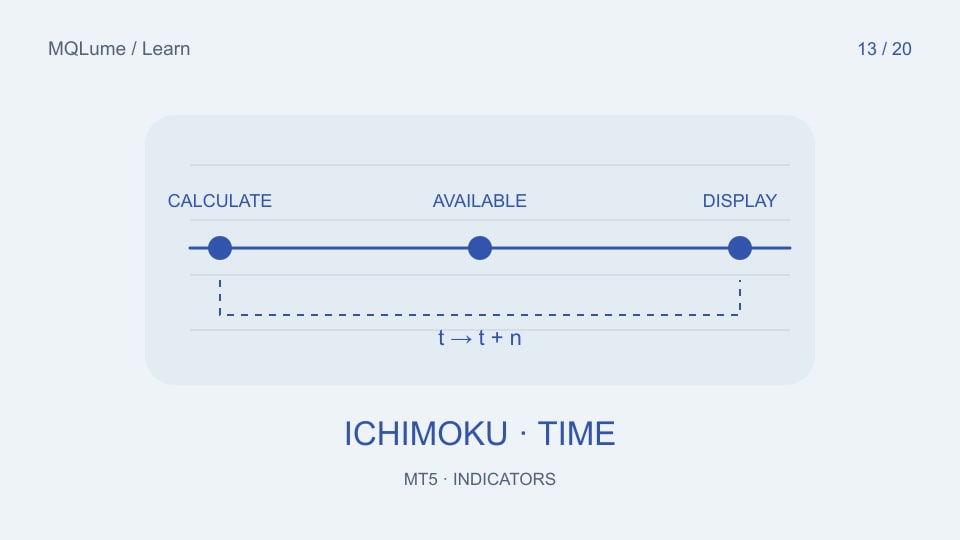
The cloud's leading spans are drawn ahead of their calculation location. Their input still comes from data available when calculated. A future chart position is a display offset, not a forecast containing future observations.
The reverse applies to the lagging span: a current close drawn backward was not known at that earlier historical time. Reading it as though it had been available there introduces future information into a historical decision.
Keep two timestamps in your notes
For each component, distinguish calculation time and plotted time. In a synthetic example with displacement 26 bars, a value calculated at bar t can be displayed at t+26. At a historical decision at t, the cloud drawn at t was calculated earlier, while the newly calculated span is displayed farther right.
If you read buffers from code, verify the documented shift semantics for that specific component and compare exact timestamps with the chart. Do not fix an apparent mismatch by blindly adding or subtracting 26 everywhere.
Use the cloud as a structured description
Price above, within or below the cloud describes a relationship to the displayed boundaries. Cloud thickness and the ordering of its spans add context. None of these observations alone specifies a trade, position size or risk limit.
When a chart looks especially clear, ask whether the apparent confirmation used the lagging span at its true availability time. This question is more valuable than memorizing a collection of crossing labels.
Audit one historical decision
Select a closed candle and list the data available at that moment. Record the conversion line, base line and displayed cloud values, along with the calculation times that produced them. Then advance one bar and repeat without redrawing the earlier decision.
The cross-platform audit covers alignment differences, and the look-ahead guide explains why a clean historical chart can still encode unavailable information.