Indicators
Why MT5 and TradingView indicators disagree: a calculation audit
Start by comparing the same thing
Matching indicator names and periods does not establish matching calculations. Two charts can differ in their price feed, session boundaries, applied price, smoothing method, initialization and treatment of missing bars. Audit those inputs before concluding that one platform is wrong.
Record the exact symbol, venue or broker feed, timeframe, timezone, session selection, indicator version, inputs and timestamp being compared. “Gold, one hour, RSI 14” leaves several of these unspecified. A CFD quote and an exchange-traded contract are different inputs even when their charts appear similar.
Choose a short interval and export or inspect exact OHLC values. If the closes already differ, an indicator difference may be a correct consequence of different data. Do not tune the formula to hide that discrepancy.
MACD is a useful example of a naming trap
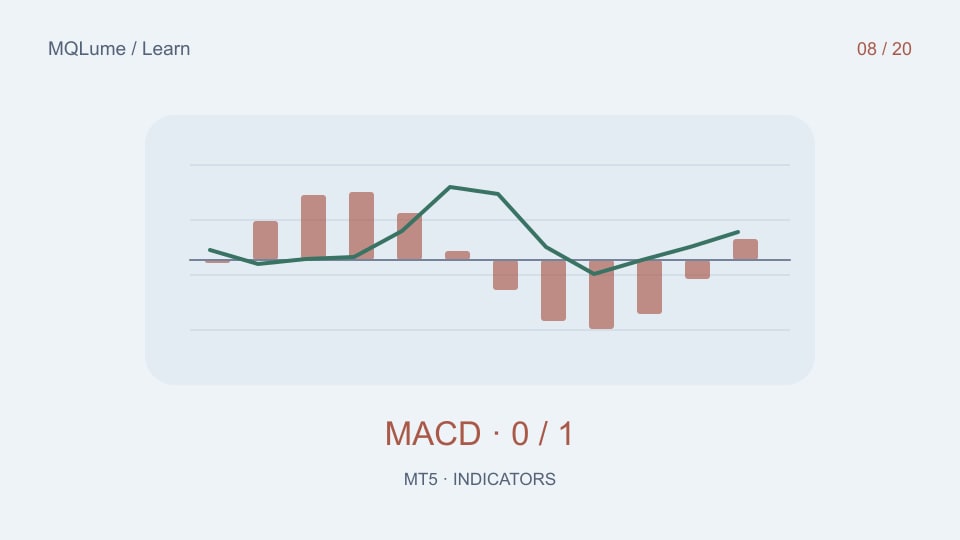
MetaTrader's documented standard MACD uses a fast EMA minus a slow EMA, with an SMA signal line. Its main output is commonly drawn as a histogram. TradingView's MACD exposes moving-average choices and a histogram defined as the MACD line minus the signal line. Compare the selected formula and output, not the fact that both plots use bars.
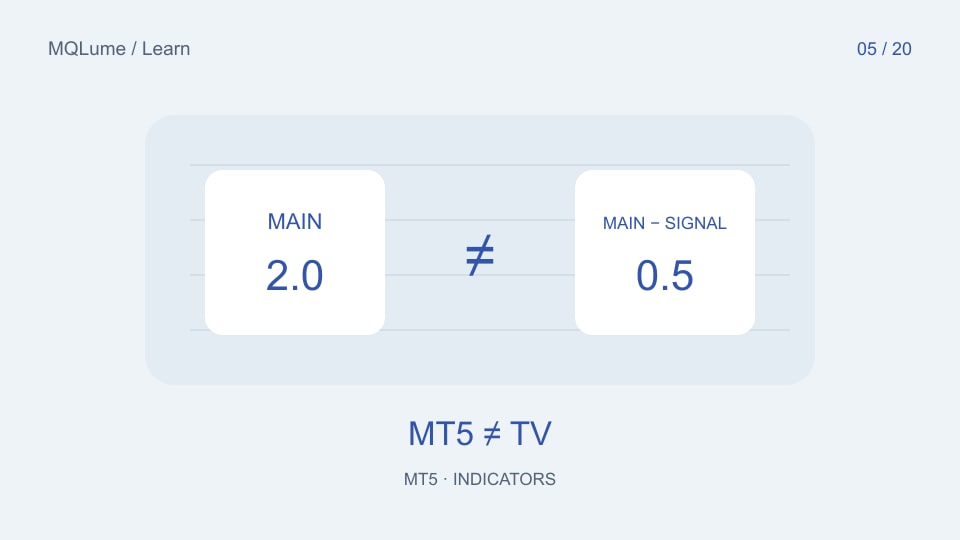
In a synthetic example, suppose the MACD line is 2.0 and the signal line is 1.5. The difference histogram is 0.5. A chart displaying the main MACD value as bars will show 2.0 at that location. Neither display needs to be erroneous; they encode different quantities.
Read the MetaTrader calculation and TradingView's MACD description alongside the actual settings. A custom MT5 “two-line MACD” can use yet another signal smoothing method. Its name is not its specification.
Match initialization as well as the recurrence
For an EMA with period N, a common recurrence uses alpha=2/(N+1). Even when both implementations use that alpha, different seeds can produce different early values. If they subsequently receive identical inputs, the difference from a seed mismatch decays by a factor of (1−alpha) each step.
With N=3, alpha is 0.5. An initial difference of 4 becomes 2, then 1, then 0.5 after successive identical updates. This synthetic example helps distinguish a warm-up discrepancy from a permanent formula mismatch. A difference that repeatedly jumps at session boundaries needs a different explanation.
For Wilder-style smoothing, the factor and initialization may differ from an EMA with the same displayed period. Check the exact implementation. MetaTrader exposes both iADX and iADXWilder; treating them as interchangeable because both contain “ADX” discards an important distinction.
Align bars by timestamps and session rules
Compare a closed bar with a closed bar, and align actual opening timestamps. A daily candle built around one server's midnight need not match a daily candle built around another session. This changes the OHLC sequence before any indicator is calculated.
Missing bars are another source of drift. One dataset may skip a period with no ticks while another representation includes a placeholder. A 20-bar window then spans a different elapsed interval. Document whether the algorithm is bar-count based or time based.
For a higher-timeframe overlay, identify the source candle that was available at the lower-timeframe decision. Do not compare an unfinished live source candle with its final historical value. The multi-timeframe alignment guide explains why index equality is not time equality.
Find the first disagreement with a layered audit
Compare in order: timestamps, raw OHLC or volume, applied-price transformation, intermediate moving averages, final numeric output, signal threshold, then visual shift. Stop at the first disagreement. This prevents later stages from disguising an earlier input problem.
| Layer | Example discrepancy | Next check |
|---|---|---|
| Data | Close differs | Symbol/feed/session |
| Formula | Same close, different average | Method and seed |
| Output | Same lines, different bars | Main line versus difference histogram |
| Presentation | Same value, different location | Plot shift and timestamp |
Use raw values with an explicit tolerance. Rounding both platforms to two decimals can conceal a threshold crossing. Conversely, a tiny floating-point difference should not be called a major calculation failure unless the downstream rule makes it material.
Port rules only after numerical agreement
Once the values agree on a fixed dataset, compare event timing. A crossover condition requires both the previous and current eligible observations; testing only whether one line is above another produces a state, not a new crossover event.
Then specify how an EA would act: next available quote, order type, costs and exits. Pine strategy settings and MT5 tester settings describe different execution environments. Matching indicator values does not imply matching fills or equity curves.
Keep a compact parity fixture with normal data, a gap, a flat region and a reset. Re-run it whenever a formula or dependency changes. This is more reliable than comparing two screenshots chosen because their final shapes look similar.
Know when a difference is expected
If the two feeds or sessions cannot be made identical, document the comparison as sensitivity analysis rather than exact parity. If a proprietary indicator does not disclose its formula, you can compare observed outputs but cannot claim to have verified its internal calculation.
The practical result is a clear discrepancy report: what matched, where divergence began, what changed it and what remains unknown. That report is useful whether you are choosing a charting tool, writing an indicator or deciding whether a strategy can be meaningfully transferred.
Practice files
These CSV files contain synthetic teaching data, not market observations or investment results.