Indicators
MT5 MACD: why its histogram is not the histogram you expect
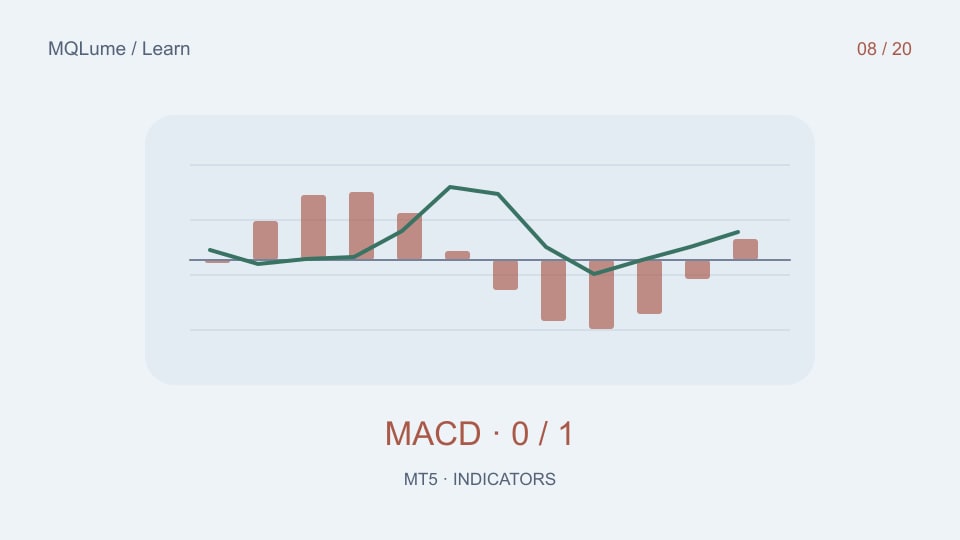
Name the quantity behind each plot
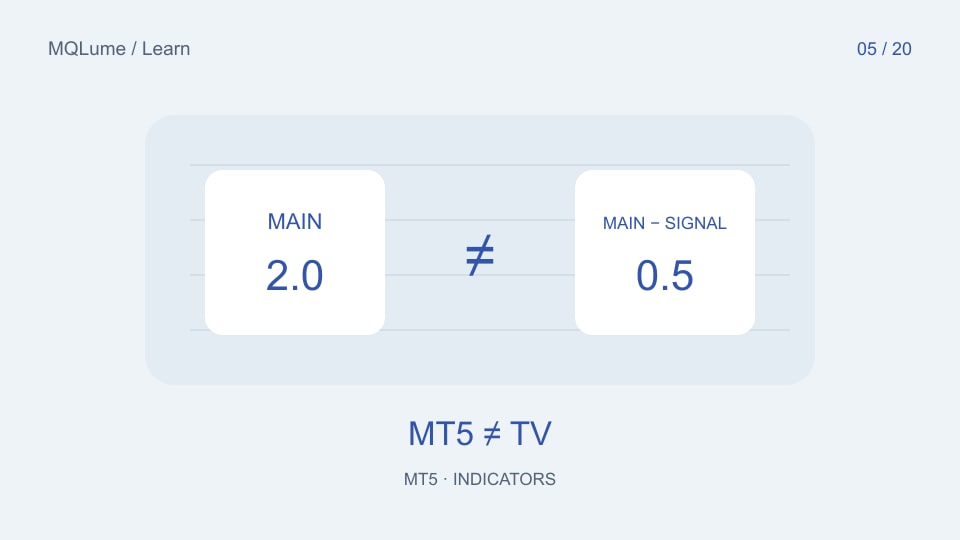
MACD starts with the difference between fast and slow moving averages. A signal line smooths that difference. A third quantity, the main value minus the signal, is often called the MACD histogram on other platforms. The standard MetaTrader display commonly draws the main MACD value itself as bars.
This matters when a tutorial says “the histogram crossed zero”. It might mean the fast and slow averages crossed, or it might mean MACD crossed its signal line. Those are different conditions.
Read a small numerical example
Suppose the fast EMA is 105 and the slow EMA is 103. The main MACD value is 2. If its signal value is 1.5, the main-minus-signal difference is 0.5. A bar displaying 2 and a bar displaying 0.5 can both be correct representations of different quantities.
If the next main value is 1.4 while the signal is 1.5, the main value remains above zero but its difference becomes −0.1. A rule based on zero-crossing of the main series does not fire at the same moment as a rule based on crossing the signal line. These numbers are synthetic.
Match the MT5 formula and buffers
The standard MT5 calculation uses an EMA difference and an SMA signal line. In iMACD, buffer 0 is the main line and buffer 1 is the signal line. If you need their difference, calculate it explicitly after successfully obtaining matching timestamps.
A custom two-line MACD may use different smoothing. Record the program identity and inputs rather than assuming that any indicator named MACD shares the standard formula.
Separate position, crossing and slope
Main above zero is a state. Main crossing from below to above zero is an event. Main rising while still below zero is a slope observation. They can imply different hypotheses about momentum, and none is a complete entry-and-exit specification.
Use two eligible closed-bar observations for a crossover. Handle equality consistently and do not evaluate stale values after a failed buffer copy. If you use intrabar readings, record that choice because the crossing can disappear before the candle closes.
Compare platforms in layers
First match the price feed, timeframe and applied price. Then match fast/slow average methods, signal method and initialization. Finally compare the numerical output and visual style. Looking only at the histogram shape skips the steps most likely to explain a disagreement.
The cross-platform calculation audit provides a repeatable process. A matching indicator plot still does not guarantee matching strategy fills, spreads or results.