Indicators
MT5 Stochastic: %K, %D and slowing explained
Stochastic measures location within a range
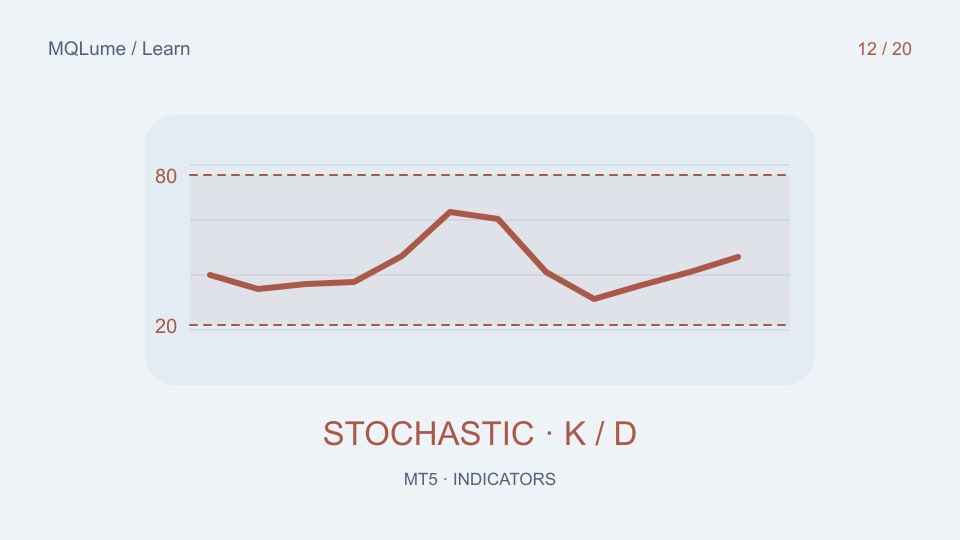
The Stochastic oscillator relates a close to a recent high–low range. A high value means the close is near the upper part of that range under the selected calculation. RSI instead compares upward and downward price changes. Their shared 0–100 scale does not make them equivalent.
Start with the raw relationship 100 × (close−lowest low)/(highest high−lowest low). The plotted MT5 values also depend on smoothing controls, so a hand calculation of the raw value may not match a slowed plot.
Keep the three controls separate
%K period defines the lookback used for the range. Slowing controls internal smoothing of %K. %D period controls the smoothing used for the signal line. The selected moving-average method and price field also affect the result.
When someone describes “5,3,3”, ask which field each number belongs to. Do not change all three at once and then attribute the result to a shorter lookback. Save the full input set with any example or test.
Calculate the unsmoothed value first
For a synthetic range with high=110, low=90 and close=105, raw %K is 75. If the close moves to 110 without a new high, it becomes 100. If a new high changes the range, both the numerator and denominator may change.
At a flat range, the denominator is zero. A custom implementation must define that case instead of producing an invalid number. When reproducing MT5's built-in output, verify its smoothing and edge behaviour rather than substituting a convenient flat value and claiming exact parity.
A high reading can persist
Levels such as 80 and 20 describe locations in the selected recent range. They do not establish that the current move is exhausted. A strong trend can repeatedly close near one edge, keeping the oscillator high or low.
Distinguish %K crossing %D, crossing a level, and remaining beyond a level. Use two eligible observations for a crossing and record whether they are closed-bar or intrabar values. A screenshot taken after the move cannot establish when the crossing first appeared.
Compare raw and smoothed responses
On one fixed interval, compare slowing=1 with a larger slowing value while keeping the other settings unchanged. Record event counts and delays at the same timestamps. Then compare RSI on those timestamps and explain why the values differ.
For an original range-position implementation without Stochastic smoothing, see the custom-indicator tutorial. Treat it as a teaching comparison, not a replacement claimed to match the built-in indicator.