Indicators
MT5 RSI: settings, 70/30 levels and the overbought trap
What RSI measures
RSI compares smoothed upward and downward price changes and expresses the relationship on a 0–100 scale. A high reading means recent gains dominate under the chosen calculation; it does not mean price is required to fall next. A low reading likewise does not establish a floor.
Add Relative Strength Index from Navigator's oscillator group. Record the period and applied price. A period of 14 is a useful familiar baseline for learning the display, not a universally optimal setting.
Overbought is a description, not an order
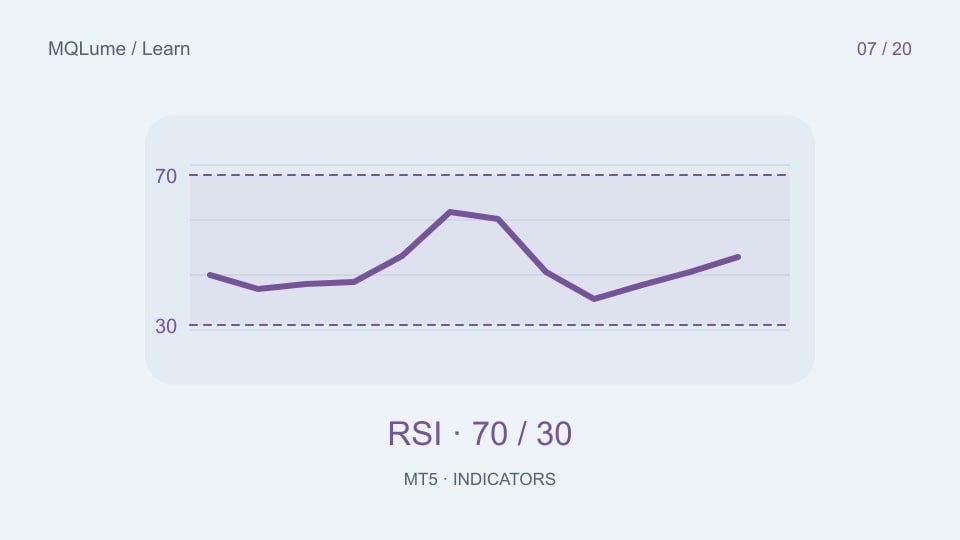
The familiar 70 and 30 levels are reference thresholds. In a persistent trend, RSI can remain beyond one of them while price continues. Selling every reading above 70 confuses an observation about recent momentum with a complete reversal strategy.
In a synthetic sequence of closed-bar RSI values [68,72,76,71,69], four different questions arise: when did RSI first cross above 70, how long did it stay above, when did it cross back below, and what did price do afterward? Those are different events and should not be mixed in one test.
Code a crossing, not repeated membership
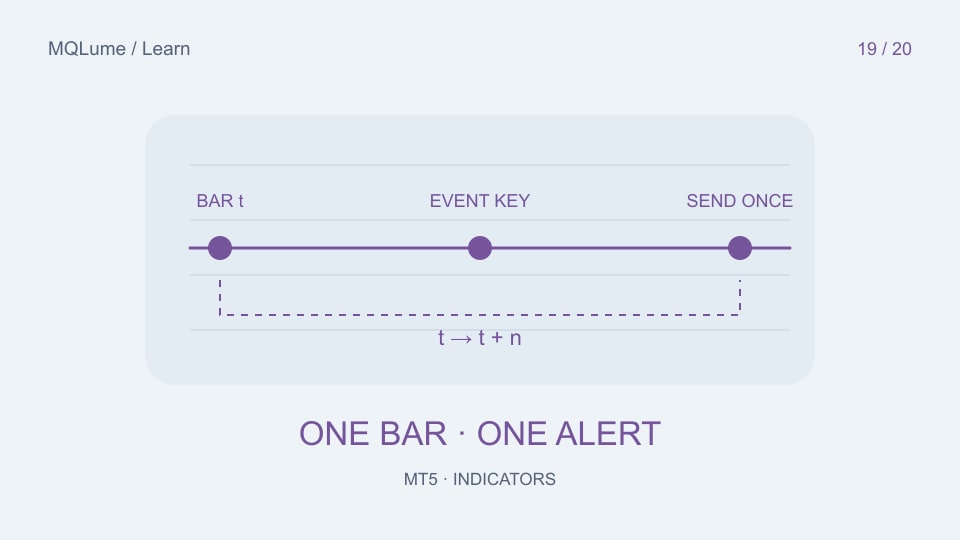
For a closed-bar upward crossing of level L, compare the previous eligible RSI value at or below L with the latest eligible value above L. A condition that merely checks RSI > L stays true for multiple bars and potentially many ticks. Deduplicate alerts by signal-bar timestamp and direction.
With iRSI, check handle validity and the number of values actually copied before evaluating the condition. Decide how equality is treated and use the same rule in the chart, alert and backtest. See the alert guide for event identity.
Change one input and explain the consequence
A shorter period usually reacts more quickly and produces a noisier sequence; a longer period smooths changes. Applied price also matters: close and typical price are different inputs. Compare settings on the same timestamps instead of selecting whichever looks best at one turning point.
For an arithmetic illustration, average gains of 2 and average losses of 1 give a ratio of 2 and RSI of about 66.67. This is a synthetic calculation, not an expected market reading. The calculation needs explicit handling of zero-loss and flat-data cases when implemented from scratch.
A useful first exercise
Mark the first crossing, continuation and return inside the threshold for several sequences. Include cases where price continues against a proposed reversal. Record the values only after the chosen candle closes, then compare them after a chart restart.
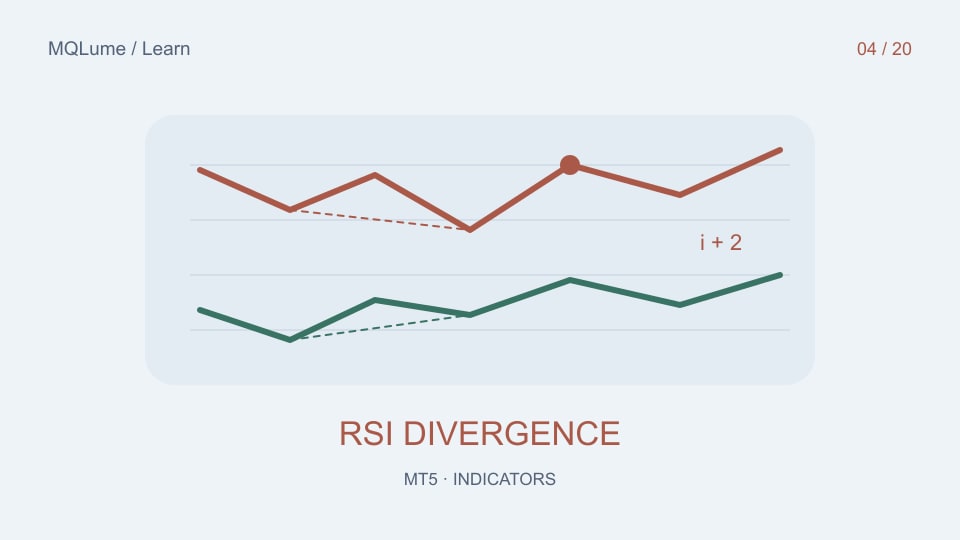
Do not add divergence by eye and assume it was available at the pivot. The confirmed-pivot guide separates the pivot's location from the later time at which it becomes usable.