Indicators
RSI divergence in MT5: confirmed pivots, timing and false signals
Turn a visual pattern into an explicit rule
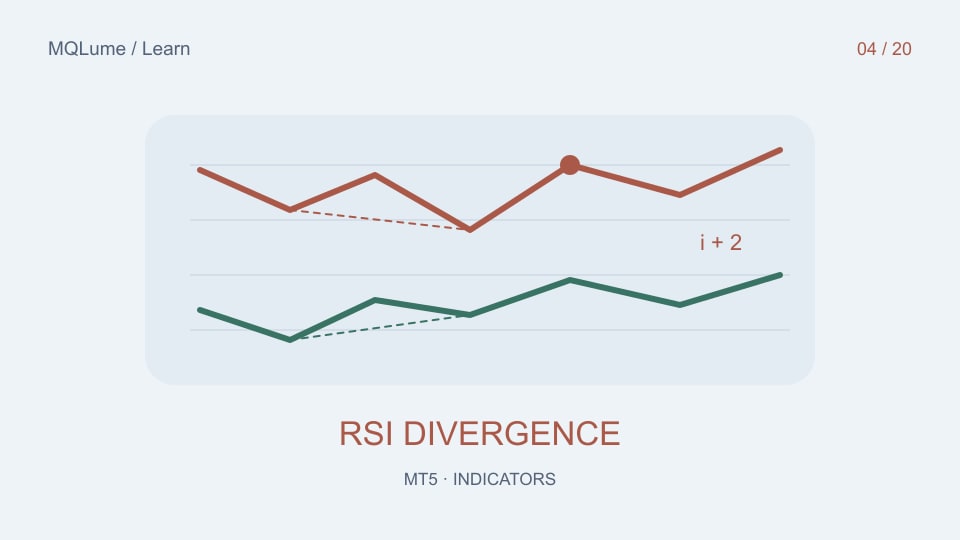
Regular bullish divergence describes a lower price low paired with a higher oscillator low. Regular bearish divergence describes a higher price high paired with a lower oscillator high. This relationship describes two observations; it does not establish that a reversal will follow or specify an entry.
Before coding, choose how swings are identified, how price and oscillator points are paired, how much separation is allowed, and how ties are treated. “Use the obvious lows” is not reproducible. Two people can draw different divergence lines on the same chart without either making a calculation error.
This guide uses a deliberately simple experimental definition: price pivots with two closed bars on each side, and RSI sampled at the exact price-pivot timestamps. It does not claim that independent RSI pivots, hidden divergence or a different window are equivalent. Those are separate hypotheses to test.
A pivot needs future bars relative to its location
With oldest-first indexing, a strict low pivot at i must be lower than the two lows before it and the two lows after it. It cannot be confirmed until the bar at i+2 has closed. Equal lows fail this strict rule; a tie-breaking rule would produce a different set of events.
# Pseudocode; chronological bars, candidate i
confirmed_low = all(low[i] < low[j]
                    for j in (i-2, i-1, i+1, i+2))
available_after = close_time[i+2]
The code that scans historical bars must preserve this availability time. Drawing the marker back at i is a display decision. Recording an entry at i would be a look-ahead error because the confirming bars had not yet happened.
For a live implementation, wait for the next bar to open before treating the previous bar as closed. On a chart with a forming bar at series index 0, the most recent candidate with two fully closed right-side bars is older than a casual “two bars back” interpretation suggests. Verify by timestamps rather than relying on a memorized shift.
Pair price pivots and oscillator observations consistently
In this design, take RSI at each confirmed price pivot. Require both RSI values to be available and compare them using the same indicator settings. If instead you choose the nearest RSI pivot within a tolerance window, define that window and whether it can extend into data that was unavailable at the confirmation time.
A synthetic bullish example has a first price low of 100 with RSI 25 and a later price low of 98 with RSI 32. The price low decreased while RSI increased. This satisfies the selected relationship, but the second pivot still requires confirmation. The numbers are an illustration, not a backtest or a forecast.
Now replace RSI 32 with missing data. The correct result is “cannot evaluate”, not bullish divergence. Replace the second price low with 100 and the strict lower-low condition fails. Recording these counterexamples prevents a charting routine from quietly relaxing its own rules.
Emit one event when the second pivot is confirmed
Use the two pivot timestamps and direction as an event identity. Emit the event once, at the second pivot's confirmation time. Repeatedly reading the same pair on every tick should not create a stream of duplicate signals.
Store the pivot time, confirmation time, price and RSI for both endpoints. Keep the first emitted record even if a later history correction changes the calculation. A revised historical annotation and the observation originally available to the user are different evidence.
If a new lower low appears before confirmation, the candidate may change. That is expected for an unfinished candidate; it is why the interface should distinguish provisional and confirmed states. Use different visual styling and avoid calling a provisional marker “non-repainting”.
Test trend persistence and clustered signals
Divergence can occur repeatedly while price continues in the same direction. Count clusters rather than pretending every nearby divergence is an independent experiment. Define whether a new pivot replaces the previous comparison, whether overlapping pairs are allowed and how a hypothetical position would handle subsequent events.
Changing RSI period, pivot width, maximum distance, minimum price difference and confirmation filters creates many configurations. Keep a record of the alternatives. A chart selected after trying many combinations can look compelling even if the pattern has no durable predictive value.
Separate detection quality from trading performance. First verify that the detector emits exactly the events required by its definition. Only then add an entry, exit, cost model and unseen validation period. A perfectly implemented detector can still support an unprofitable strategy.
Use adversarial fixtures before market screenshots
Build small arrays for a strict pivot, equal lows, insufficient right-side bars, a missing RSI observation, an oversized gap between pivots and a second event with the same identity. For each fixture, write the expected event count and earliest availability time before running the detector.
Compare incremental processing with a full historical recalculation. The confirmed event records should match when both runs use the same available data and definition. If they differ, inspect the candidate replacement and deduplication logic before tuning the indicator period.
A timestamped fixture also makes AI-assisted coding review more concrete. Ask for an explanation of which input bar makes a signal available and require the model to walk through the counterexamples. Do not accept “it uses closed bars” as proof that it avoids future information.
A practical chart-reading workflow
On a demo chart, mark two confirmed price pivots, read RSI at those same timestamps and write down the confirmation time. Then look forward from that time without moving the starting point back to the prettier price extreme. Repeat on failed examples as well as attractive ones.
Use the RSI interpretation guide for the oscillator itself and the indicator-validation lab for separating signal evidence from trade outcomes. The purpose is a consistent observation method, not a promise that divergence identifies market tops or bottoms.
Practice files
These CSV files contain synthetic teaching data, not market observations or investment results.