Indicators
How to backtest an MT5 indicator without inventing a trading strategy
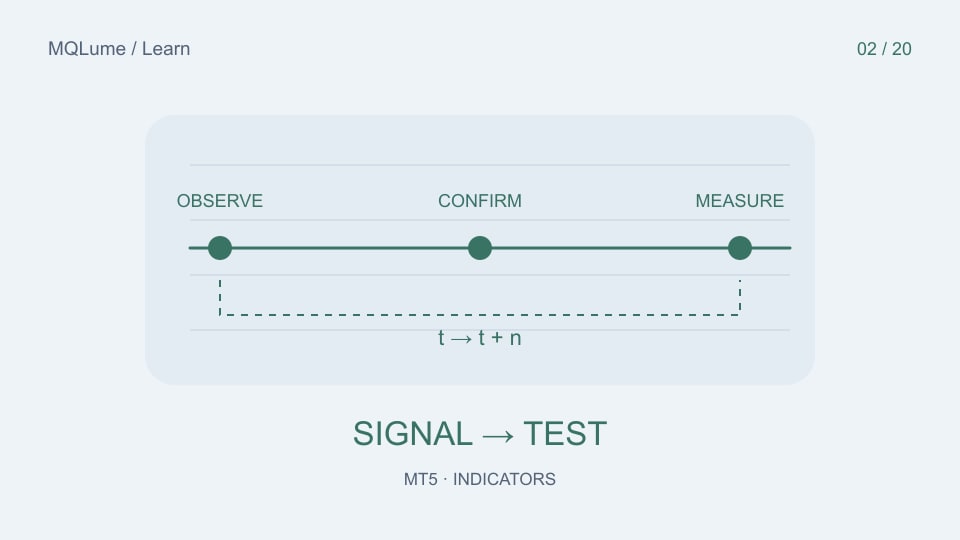
Choose what the test is meant to establish
“Backtest this indicator” can mean three different jobs. A display test checks whether plots are drawn correctly. A signal test checks what values were available at each decision time. A strategy test adds entry, exit, sizing and execution rules and measures resulting trades. Passing one does not pass the others. A profitable-looking historical screenshot answers none of them on its own.
Start with a question you can falsify: “Does the confirmed bullish arrow become available only after the signal bar closes?” is testable. “Does this indicator work?” is too vague. Write the symbol, timeframe, version, inputs, buffer index, empty sentinel and confirmation rule before running anything.
For a higher-timeframe input, also write which higher-timeframe candle was available at the decision time. A closed M5 candle can still belong to an unfinished H1 candle. Reading the final H1 value later would give the historical test information the live decision never had.
Build an observation ledger before a profit report
Create a log with decision time, signal-bar time, source-timeframe time, raw value, availability status, signal direction and indicator version. Preserve the first observation separately from later recalculations. An arrow drawn retrospectively at 10:00 but first available at 10:15 belongs to the 10:15 decision, even if its chart position remains 10:00.
| Decision time | Signal bar | Observation | Meaning |
|---|---|---|---|
| 10:05 | 10:00 | Empty | No confirmed signal yet |
| 10:10 | 10:00 | Empty | Still unconfirmed |
| 10:15 | 10:00 | Bullish | First actionable observation |
This is a synthetic delayed-confirmation example. It illustrates why an attractive arrow location is not an executable entry price. Retain both timestamps in exported data instead of shifting the signal earlier to match the graphic.
If a buffer request fails or returns fewer values than requested, record missing data and retry under a defined policy. Do not interpret an uninitialized zero as “sell”, “neutral” or “no change”. Missing observations must remain visible in the final counts.
Use a small test matrix with one variable at a time
Begin with one symbol and one short, clearly identified period. Compare a continuous run with a restart, then a visual run with an otherwise identical non-visual consumer. Test startup before all required history is ready. Test changing the chart timeframe and restoring the original inputs. If your indicator depends on another symbol, include a period where that symbol has different trading hours.
MetaTrader's tester can calculate indicators differently depending on how they are used and requested. Review the official tester behaviour before comparing visual and non-visual runs. Adding a tester calculation property is not a substitute for understanding a stateful indicator's intended event schedule.
For a rule that changes intrabar, an OHLC-only model may omit the price path that decides the signal order. For a genuinely closed-bar rule, a simpler model can be a diagnostic comparison, but it does not automatically validate execution costs or intrabar exits. Record the model rather than labelling every test “realistic”.
Specify a strategy only when you want trade statistics
A direction arrow does not specify order type, entry time, stop, exit or position size. Choose these explicitly before looking at profit. For example: observe a confirmed signal after bar close, permit entry at the next available quote, allow one position, use a fixed experimental exit and include spread and commission. This is a test specification, not a recommended trading system.
When both stop and target fall inside one candle, OHLC values alone do not reveal which occurred first. Resolve the order with an appropriate price path or mark the result ambiguous. Do not select the profitable ordering for winning examples and a different convention for losses.
Keep signal statistics and trade statistics separate. Signal frequency, confirmation delay and missing-data rate describe the indicator pipeline. Expectancy, drawdown and costs describe the complete trading implementation. A change to sizing can transform the equity curve without improving a single signal.
Measure disagreement and delay before optimizing
Count comparable timestamps, disagreements, missing observations and duplicates. A disagreement rate needs a denominator: 3 differences among 1,000 comparable observations is not the same as 3 among 10. Report missing observations separately; excluding them can hide the exact periods when the system failed.
Use a tolerance appropriate to the output units. A price buffer may need comparison in ticks; a bounded oscillator may need a small absolute numeric tolerance. Direction and event identity should usually match exactly. Compare unrounded numbers before comparing formatted labels.
Summarize confirmation delay in bars or elapsed time, and state which you use across weekends and session gaps. A signal available two bars later may be perfectly stable once confirmed while still being unsuitable for a rule that assumes immediate execution.
For a synthetic strategy example, 40 wins of 2 units and 60 losses of 1 unit produce 20 units before costs. A cost of 0.25 units for each of 100 trades reduces that to −5. This arithmetic demonstrates cost sensitivity; it is not an observed result for any MQLume product.
Freeze the design before checking an unseen period
Choose the development interval, validation interval and final holdout before sweeping parameters. Keep a record of every configuration tried, including abandoned ones. Selecting the best of hundreds of variations and then describing the same period as independent validation gives an inaccurate picture of the experiment.
Include trending, ranging and disrupted-data conditions where available, but do not invent a balanced sample the data does not provide. A small sample should lead to a narrower conclusion. Repeat the frozen rule on a demo observation stream and compare signal timestamps before interpreting differences in filled trades.
Do not turn a validation exercise into a live-trading test. Indicator calculations and order simulation can be investigated without placing a real order.
Write an acceptance record another person can repeat
A useful record includes the program identity, inputs, data range, tester settings, expected fixture values, observed mismatches and unresolved limitations. Attach a short example showing one correct event and one edge case. State whether the evidence covers display, signal availability, simulated trades or all three.
Finish with the narrowest supported conclusion: “The closed-bar buffer matched across these runs, with two missing startup observations” is more useful than “non-repainting and profitable”. See the existing timestamp-based repainting check for preserving observations, and the look-ahead guide for future-data mistakes.
Practice files
These CSV files contain synthetic teaching data, not market observations or investment results.