Indicators
MT5 Bollinger Bands: squeezes, band width and the 95% misconception
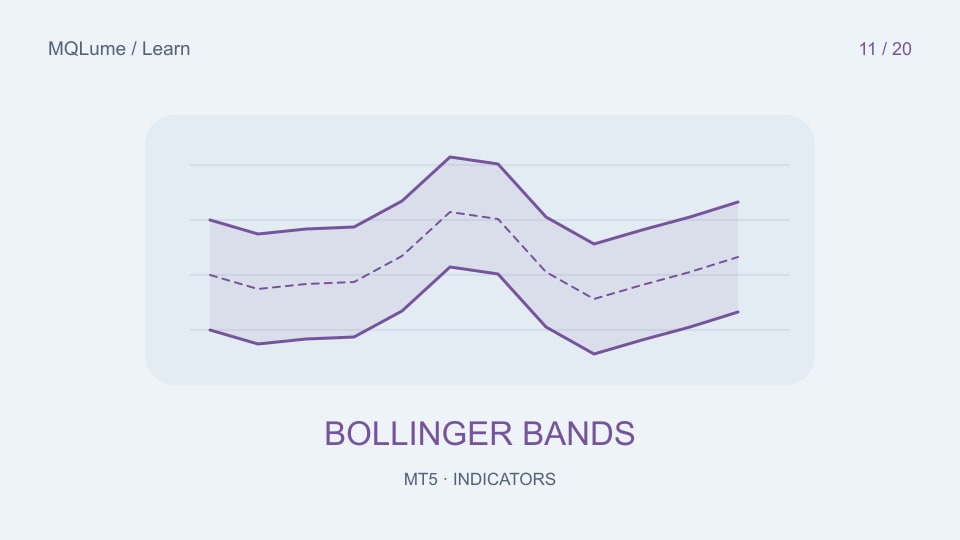
Read the three lines
Bollinger Bands place an upper and lower band around a moving average using a multiple of standard deviation. In the standard example, the middle is a 20-period SMA and the distance is two standard deviations. These are settings to understand and test, not an optimal configuration for every market.
Adding the indicator does not create a probability model. The bands summarize a rolling sample of prices; they do not guarantee that a fixed percentage of future prices will remain inside.
Two standard deviations are not a trading guarantee
The familiar “about 95%” statement belongs to a particular normal-distribution model. Market prices, rolling estimates and future outcomes do not automatically satisfy that model. A touch of the upper band is therefore not proof that price is statistically required to reverse.
Price can move along a band during a trend. A breakout rule and a mean-reversion rule can interpret the same touch in opposite ways. Decide which hypothesis you are evaluating before selecting examples.
Make a squeeze measurable
One descriptive measure is band width = (upper−lower)/middle, when the middle is nonzero. With synthetic values upper=110, lower=90 and middle=100, width is 0.20, or 20%. Keep the ratio and percentage notation consistent.
Instead of calling a chart “tight” by eye, compare its current width with a predefined historical window or threshold. State the window and whether the comparison excludes the current observation. A contraction describes reduced dispersion; it does not identify the eventual breakout direction.
Use band position carefully
A common normalized location is %B = (price−lower)/(upper−lower). With the same bands and price=105, %B is 0.75. Values can exceed 1 or fall below 0 when price lies outside the bands. A zero-width band requires a defined missing or flat-data policy.
Do not silently clamp out-of-band values if your later rule needs to detect them. Keep applied price and shift consistent with the chart. A plotted forward shift changes where the band appears, not what data was available earlier.
Compare contractions that break in both directions
Record width, price location and the next observations for all events satisfying a frozen squeeze rule. Include breakouts that fail and intervals that remain quiet. If you add confirmation, record its delay rather than entering retrospectively at the start of the squeeze.
Use the ATR guide to contrast range-based volatility with dispersion-based bands. The two can provide different descriptions, but their combination still needs a defined purpose.