Indicators
MT5 indicator visualization: plots, buffers, colours and chart objects
Treat data, plots and decoration as different layers
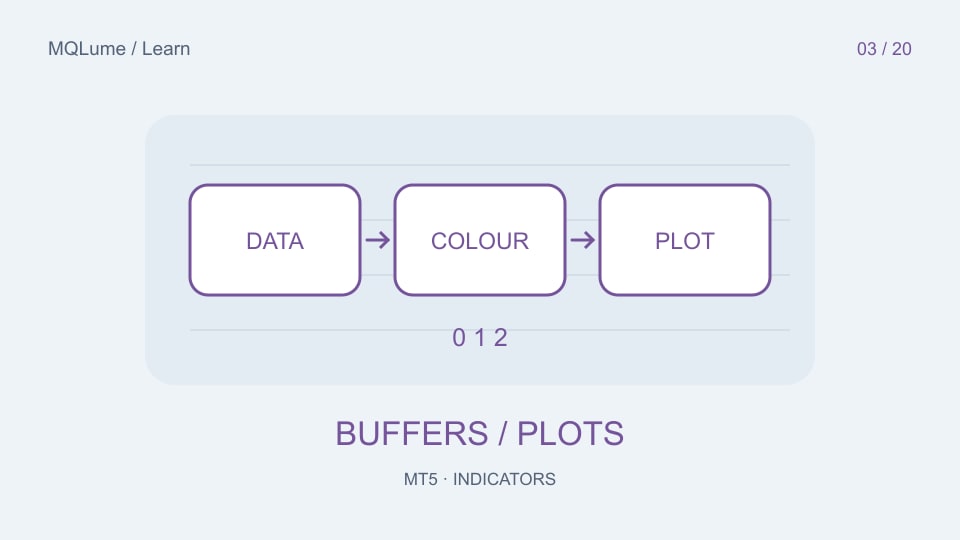
A chart can be beautiful and still expose an unusable interface to an EA. Separate three layers: calculated values, plotted representations and decorative objects. A moving line can be drawn from an indicator buffer; a label or trend line may instead be a chart object. An EA that reads a buffer does not automatically receive the meaning of every object visible on the chart.
Define the consumer contract first. For a directional signal, publish whether the data is a price level, a signed state, an event flag or an empty cell. Include its confirmation timing and persistence. “Buffer 0 contains arrows” is incomplete: does it contain the arrow's y-coordinate, the direction, or zero except on signal bars?
Keeping these meanings explicit also helps manual readers. The Data Window should expose useful numerical values, and labels should use the same units as the plot. A point offset for visual spacing is not an additional price forecast.
Map plots to the buffers they actually require
Different drawing styles require different buffer layouts. A line is not configured like a two-boundary fill or a coloured candle plot. Consult the drawing-style reference before allocating buffers. Reserve INDICATOR_CALCULATIONS for intermediate work and INDICATOR_COLOR_INDEX for a plot's palette indices.
Suppose the visible output is a coloured line. Its numeric values and its colour selection are distinct arrays. Palette index 1 means the second configured colour; it is not a second price series. If a consumer needs a stable direction state, expose and document a dedicated data buffer rather than requiring it to reverse-engineer a colour palette.
Write a small mapping table in the source documentation: buffer index, meaning, unit, empty value, and when it becomes final. Keep it stable across versions, or version the contract alongside the indicator. Rearranging buffers can break an EA even when the chart looks unchanged.
Make missing data visibly different from zero
Choose an explicit empty sentinel and initialize every cell you intend to leave absent. A zero-price arrow may disappear below the chart; an oscillator value of zero may be perfectly valid. Reusing zero as missing data without documenting it creates contradictory display and automation behaviour.
Consider a three-point sequence [12, empty, 14]. Decide whether a gap should remain visible or a style should connect the surrounding valid points. Then choose the appropriate plot style rather than assuming every line renderer treats empty cells identically. For rare signal arrows, absence is usually a genuine missing event, not a value that should be interpolated.
On a full recalculation, clear cells that no longer contain an event. Otherwise an old arrow can survive in a buffer after the new calculation decides there is no signal. On an incremental recalculation, clear each recalculated signal cell before applying the current condition. This is particularly important when the unfinished bar changes direction.
Keep the drawn location separate from availability
A pivot can be drawn on an earlier candle after later bars confirm it. That is a legitimate annotation if the delay is explained. It becomes misleading when the drawing is presented as a signal that could have been traded at that earlier candle.
In a synthetic example, a low occurs at 09:30 and needs two subsequent closed bars for confirmation. The label may remain at 09:30, but the event log must record the later confirmation time. Expose both times when exporting signals. A horizontal plot shift similarly changes appearance, not the time at which the underlying data was known.
When comparing a plot with CopyBuffer, check shift settings and bar timestamps first. Moving a line visually can make correct values appear mismatched. Avoid “fixing” the numerical data merely to align an already shifted screenshot.
Use chart objects for bounded annotations
Objects are useful for a small dashboard, a session box or a descriptive label. Use an instance-specific prefix so two copies of the indicator do not overwrite each other's names. Create only missing objects, update existing properties and remove only objects owned by that instance.
ObjectCreate is asynchronous: a successful call indicates the command was queued, not that a screenshot has already rendered the object. Repeatedly querying every object property can also force unnecessary synchronization. Design updates around meaningful changes rather than deleting and recreating hundreds of labels on every tick.
Keep a bounded history of annotations. A chart with years of per-tick objects can become sluggish even when the indicator's numerical loop is efficient. A buffer is generally a better fit for a long historical series; an object is a better fit for a small number of contextual annotations.
Design for different themes and scales
Check the plot on light and dark charts, with different candle colours and at several zoom levels. Use line style or symbol shape as well as colour to distinguish states. Do not make a thin pale line the only indication of a critical state. Place labels away from the latest price and explain whether they follow chart coordinates or fixed pixel positions.
Keep price-denominated plots on an appropriate scale. A 0–100 oscillator placed on the price chart can appear flat or invisible. Conversely, forcing a price series into a bounded oscillator scale hides valid values. If you normalize a series for display, label the transformation and preserve the original units in the documented data interface.
A technical illustration should show its assumptions. Use synthetic chart examples for teaching and label them as such; do not manufacture a terminal screenshot or imply a hypothetical signal was observed on a live account.
Verify the visible and numerical outputs together
Select a handful of timestamps and compare the source calculation, buffer read, Data Window and plotted point. Repeat after a restart, input change and history refresh. Check a normal event, a missing value, a flat window and a delayed confirmation.
For each mismatch, ask which layer failed. A correct buffer with an invisible line suggests presentation or scale. A visible object with no documented buffer suggests an interface gap. A stale arrow after recalculation suggests cell initialization or event removal. This diagnosis is faster than changing colours, buffers and trading logic simultaneously.
Practice files
These CSV files contain synthetic teaching data, not market observations or investment results.