Indicators
MT5 ADX and DI: trend strength is not trend direction
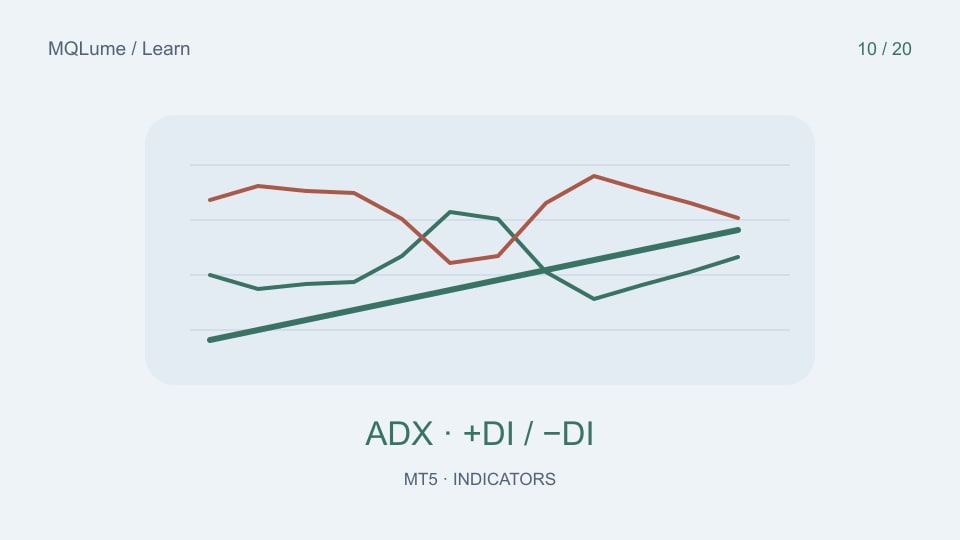
The three lines answer different questions
ADX describes the strength of directional movement under its calculation. The +DI and −DI lines provide directional context. A rising ADX does not by itself mean price is rising: a persistent downward move can also produce a strong reading.
Add the indicator to a clean chart and identify each line in its properties or Data Window. Do not infer line identity from a screenshot's colours; themes and user settings can change them.
Read direction and strength separately
In a synthetic example, +DI=12, −DI=30 and ADX rising from 20 to 28 describes stronger negative directional movement under the selected settings. Calling the rising ADX “bullish” would ignore the DI relationship.
A fixed level such as 20 or 25 is a research threshold, not a universal boundary between tradable and untradable markets. Its usefulness depends on the instrument, timeframe, formula and complete rule being evaluated.
Check ADX versus ADX Wilder
MQL5 provides iADX and iADXWilder as distinct indicator functions. Record which one your chart or EA uses before comparing values. Both expose a main series and directional series, but matching the visible period alone does not establish equivalent calculations.
For the documented functions, inspect the main, +DI and −DI buffers deliberately. A consumer that accidentally reads the main buffer as direction can produce plausible-looking but conceptually wrong signals.
Separate a crossover from an existing state
+DI above −DI is a state that can persist. A crossover requires comparing the previous eligible pair with the latest pair. If you also require rising ADX, define how many observations establish “rising” and whether the current candle is eligible.
Adding a strength filter can reduce the number of events. That is not automatically an improvement. Compare the events removed and retained on a fixed validation period, including false starts and late entries.
Inspect strong downtrends and choppy intervals
A useful learning exercise includes a rising market, a falling market and a sideways interval. Record the three values at the same closed timestamps. Notice whether the strength reading reacts after the movement is already visible.
Use the indicator-role guide to avoid stacking several trend filters without a distinct purpose. If your values disagree across platforms, audit the formula and initialization before changing thresholds.