Indicators
Which MT5 indicators should you use? Choose one job at a time
Begin with the question, not a ranking
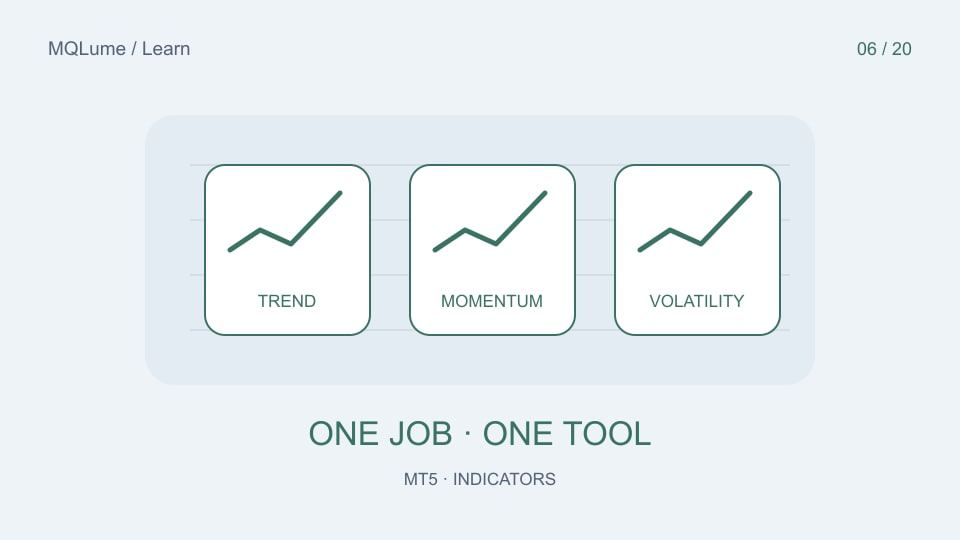
There is no universally best MT5 indicator. A useful starting point is the question you want the chart to answer: direction, momentum, volatility or activity. Choosing one tool for a defined job is easier to evaluate than assembling a screen full of “confirmations”. This guide recommends a learning sequence, not a profitable trading combination.
Start with a clean chart and one symbol. Write down what would make the indicator useful before adding it. “Helps me distinguish a rising average from a flat one” is observable. “Finds all good trades” is not a realistic specification.
Give each indicator a distinct role
| Question | Starting tool | What it does not establish |
|---|---|---|
| How is price trending? | Moving Average | Where the next reversal occurs |
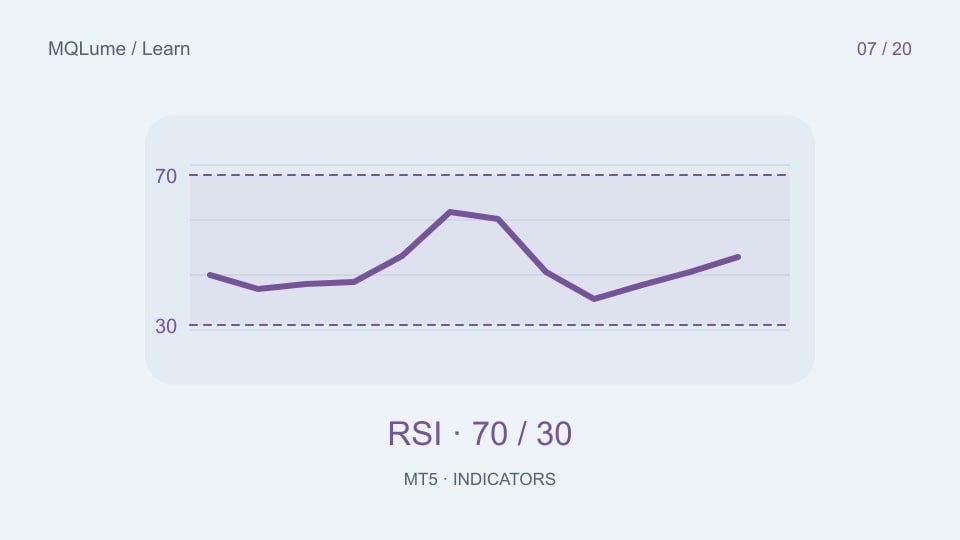
| How strong is recent directional momentum? | RSI or MACD | A guaranteed entry |
| How large are recent price moves? | ATR | The direction of the next move |
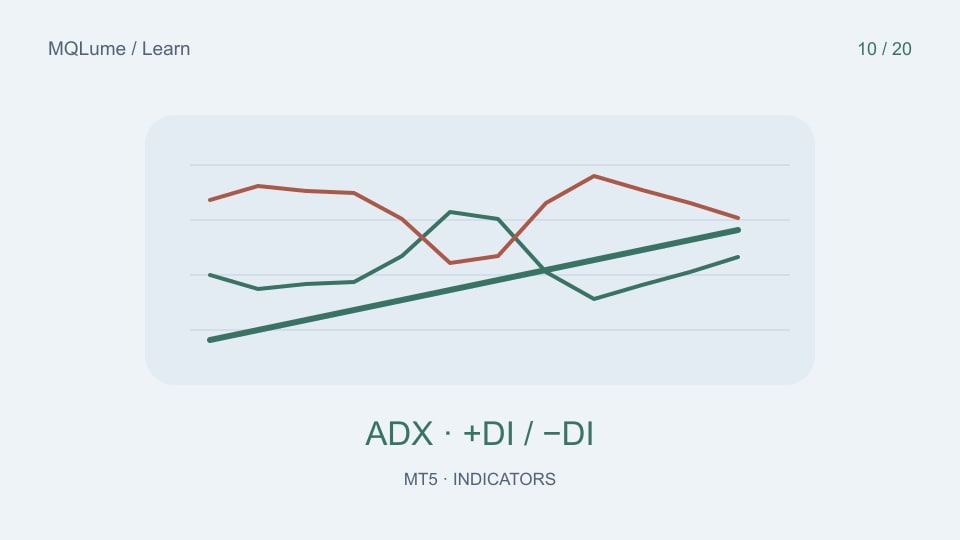
| Is directional movement persistent? | ADX with DI lines | Direction from ADX alone |
| How active is this feed? | Volumes or OBV | Global traded volume from a retail tick feed |
MT5 groups built-in indicators in Navigator. Add one, inspect its inputs and read several historical values with the Data Window. Change only one setting at a time so you can explain the difference.
Three agreeing indicators may be one repeated idea
An EMA slope, a moving-average crossover and MACD all transform price history. Their agreement is not equivalent to three independent sources of evidence. Adding more thresholds can reduce the number of signals while making the remaining historical examples look unusually clean.
A practical exercise is to remove each indicator in turn. If your explanation of every decision remains unchanged, that indicator may not have a distinct job. Keep a record of cases where the tools disagree; those cases reveal the actual decision rule more clearly than a perfectly aligned screenshot.
Use a repeatable observation sheet
For ten selected closed candles, record timestamp, price, indicator value and your interpretation. Include quiet, directional and choppy intervals. Do not choose only points where the indicator appeared helpful. Repeat with one different period and compare what changed: lag, noise, scale or event frequency.
Keep the distinction between an indicator state and a trading action. RSI above a threshold describes a state; a rule to enter, size and exit a trade requires additional decisions. Use the validation lab before converting observations into performance claims.
When a custom indicator earns its place
A custom tool is useful when it makes a specific workflow clearer: a documented multi-timeframe view, a repeatable alert or an explicit calculation unavailable in your current setup. Ask what data it exposes, when signals become final and how missing history is handled.
Browse the Indicators catalogue for existing chart tools, or use the custom-indicator tutorial to study a small original example. A paid indicator should still have a clear purpose; price and visual complexity are not evidence of predictive accuracy.