Indicators
MT5 moving averages: SMA, EMA, SMMA, LWMA and applied price
The period does not define the whole average
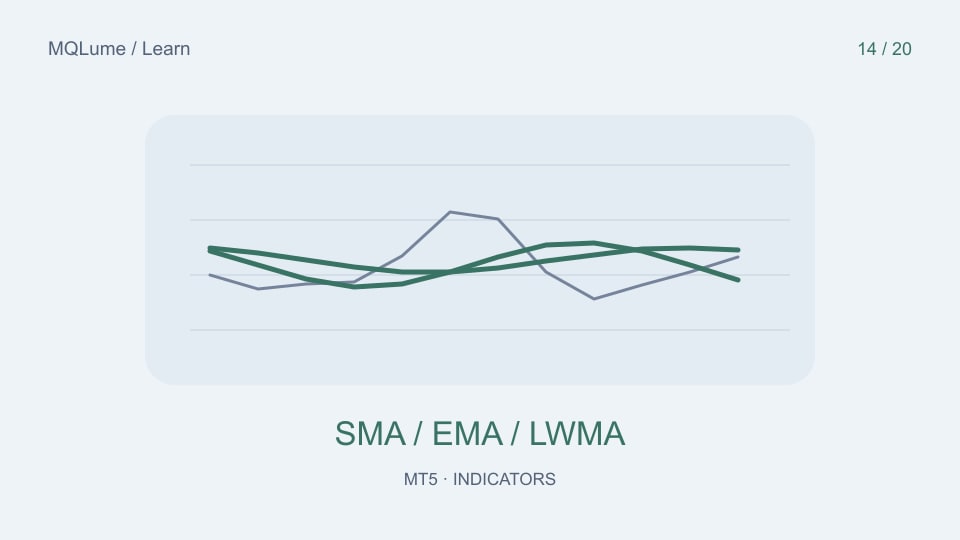
MT5 offers Simple, Exponential, Smoothed and Linear Weighted moving averages. The same period can therefore produce different outputs. An SMA weights the selected window equally; a linearly weighted average gives more weight to recent values. EMA and SMMA use recursive smoothing with different weighting and initialization details.
Record the method, period, applied price and shift together. “MA 20” is incomplete information when you want to reproduce another chart.
A three-value comparison
Using synthetic oldest-first closes [10,12,14], a three-period SMA is 12. With linear weights [1,2,3], the weighted average is (10+24+42)/6, approximately 12.6667. The larger value reflects greater weight on the latest close, not superior forecasting ability.
For an EMA, you also need the prior state or a defined seed. Comparing the first visible values after different warm-up histories can create a mismatch even when both implementations use the same recurrence.
Applied price changes the data
Close, median price and typical price are different series. Median price is (high+low)/2; typical price is (high+low+close)/3. With synthetic high=14, low=8 and close=13, those inputs are 11 and about 11.6667, while the close remains 13.
Keep the applied price fixed while comparing methods. Otherwise you change both the filter and its input, making the result harder to explain.
A shifted average is not less delayed
A plot shift moves the average's visible position. It does not make future observations available earlier or remove the smoothing delay. A line moved left can look better aligned with a past turn while being unusable at that time.
Likewise, a crossover is an event between two eligible observations, not merely the fast average being above the slow one. Define equality, candle eligibility and any confirmation delay before testing.
Measure response rather than visual appeal
Create a synthetic sequence that is flat, steps upward and then becomes flat again. Compare how each method responds and how long it takes to approach the new level. Then test an isolated spike. These fixtures reveal smoothing behaviour without a hindsight-selected market example.
Use the calculation audit when platform values disagree. Matching method names is only the first step; data and seeds must match too.